Your Workspace
Dashboard
The Dashboard is the app's home page. It shows how many job requests came in, how many booked, what needs a look, and what your ads and jobs brought back.
Quick Answer - 30 Seconds
To check yesterday: top bar → Dashboard → read Needs a look and the figures below it. Pick Last week for the whole week, or open Sources or Marketing for a longer period.
Reading the Dashboard changes nothing. Click around freely.
Where to find it
Location: top bar → Dashboard (⌘K → Dashboard). It is also the page you land on.
It has three tabs: Overview, Sources and Marketing. Everyone on the account can read them. Export CSV appears only for Company Owners and Account Admins.
What these words mean at the foot of a tab opens the definitions.
| Word | Meaning |
|---|---|
| Conversations | Every call, text, chat, scheduler visit and form that reached you. |
| Job requests | Each service a customer asked for, so a conversation asking for two services is two job requests. |
| Booked jobs | Job requests that arrived in the period and have an appointment booked so far, counted on the day the request arrived. |
| Realized Revenue | Invoices plus sold estimates on jobs OnePath booked, from your field service software. |
Job applications are never job requests: someone asking for work is not a customer.
Job requests, Booked jobs and the booking rate are the numbers the Reporting API returns as leads, appointments and booking_rate. Its three revenue figures are estimates the Dashboard doesn't show. Realized Revenue is a different number.
Overview
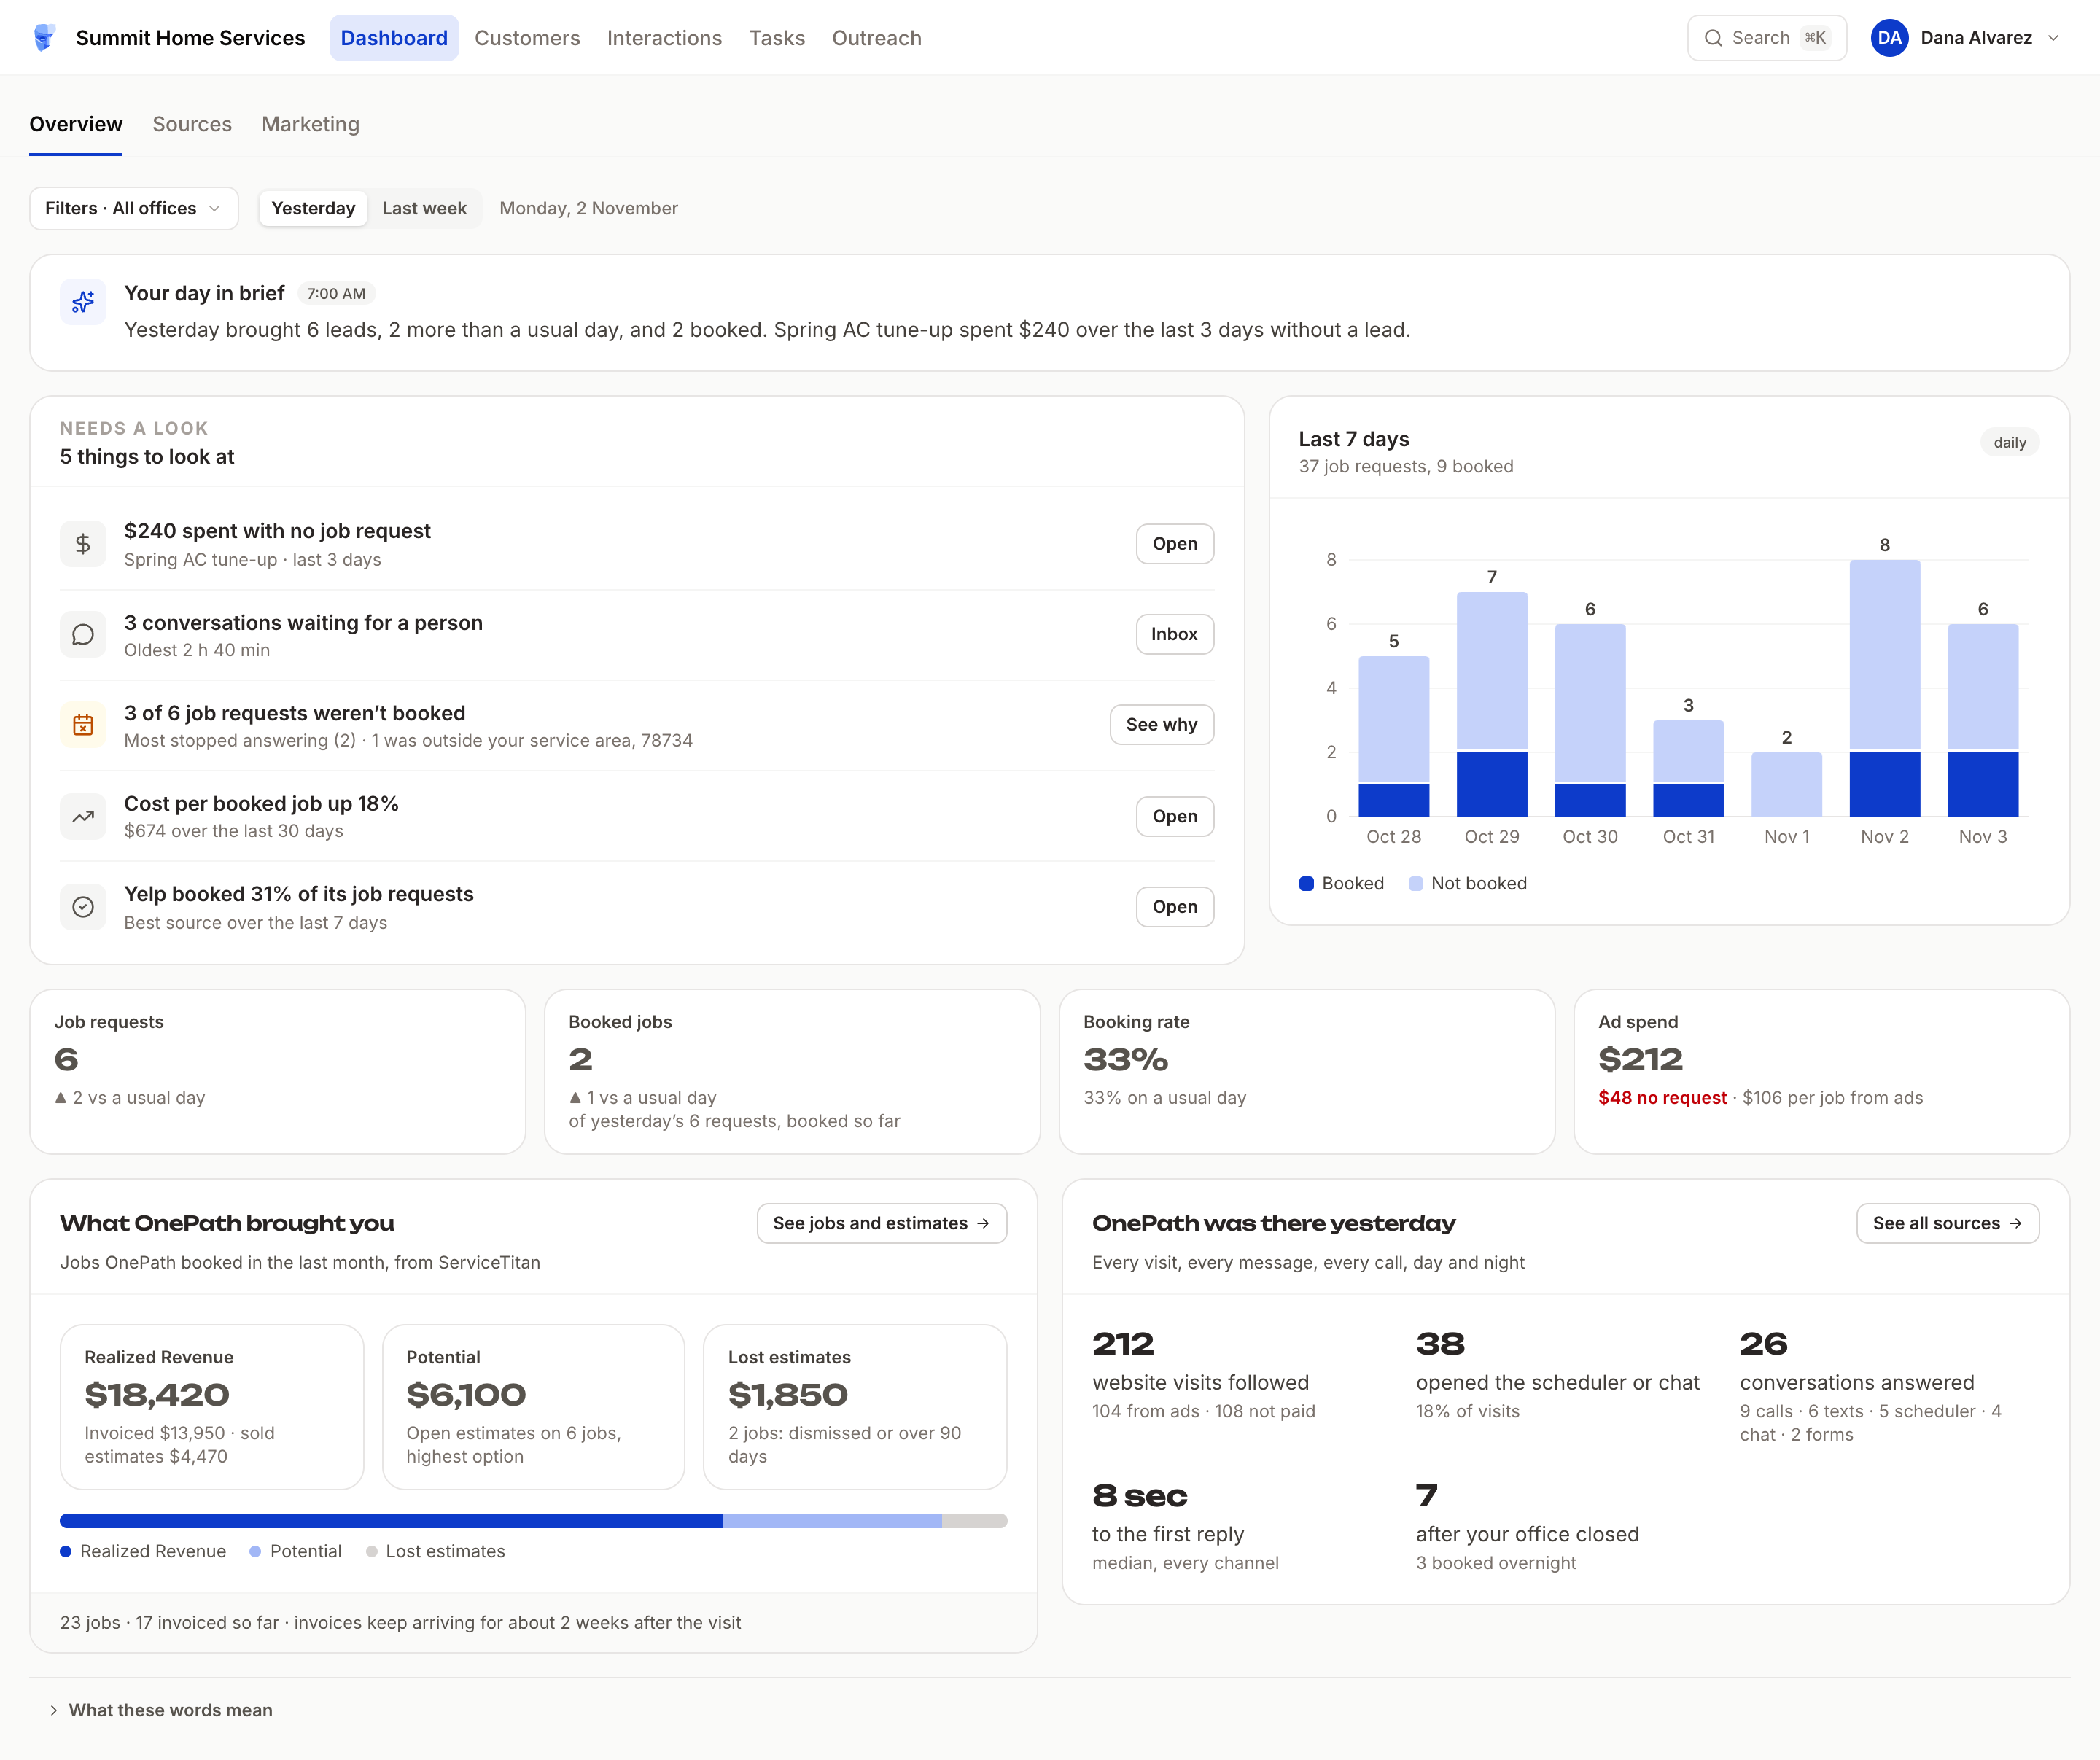
Yesterday is your last full day, on your account's clock. Last week is the seven days up to and including yesterday.
Filters appears when you have more than one office. It narrows the figures, the last 7 days and What OnePath brought you. The rest stays the whole account's.
Your day in brief
A few sentences on the day, or Your week in brief on Last week. OnePath writes them at 7:00 AM your account's time. Before then, or on an account with no conversation in the last 30 days, the card isn't shown. Nothing is wrong.
Needs a look
At most five lines, the most pressing first. Each one has Open, Inbox or See why to take you to the details. With nothing to show, the card reads All quiet.
| You may see | When |
|---|---|
| $240 spent with no job request | Campaigns spent $100 or more over the last 3 days without one. |
| 3 conversations waiting for a person | People are waiting right now, whichever window you picked. |
| 3 of 6 job requests weren't booked | Job requests from the window ended without a booking. See why opens Jobs you didn't book. |
| Fewer job requests than usual | The window brought half its usual or fewer, when a usual one brings four or more. |
| Cost per booked job up 18% | The last 30 days cost 15% or more above the 30 before. |
| Meta costs $400 per booked job | A platform's booked jobs cost 25% or more above your average over the last month. |
| Yelp: 12 job requests, 1 booked (8%) | Angi or Yelp brought ten or more in 30 days and booked a tenth or fewer. |
| 2 job applications came in | They aren't counted as job requests. See Job applications. |
| Yelp booked 31% of its job requests | Your best source over the last 7 days, among those with five or more. |
The figures
| Figure | What it shows |
|---|---|
| Job requests | Those that came in during the window. |
| Booked jobs | Those of the window's job requests booked so far. |
| Booking rate | Booked jobs as a share of job requests. |
| Ad spend | Spend in the window, what went to campaigns with no job request, and the cost per job from ads. It shows only if you had ad spend in the last 30 days. |
Each figure sits beside a usual day or week: the average of the same window in the four weeks before. A quiet Sunday is compared with Sundays. Click Job requests, Booked jobs, Booking rate or Ad spend to open those requests in Interactions.
Last 7 days draws each day's job requests, booked and not booked, with today on the right.
What OnePath brought you
With field service software connected, this card shows what the jobs OnePath booked in the last month have made. Without it, the card isn't shown. Invoices keep arriving for about 2 weeks after a visit.
Realized Revenue is invoices plus sold estimates. Potential is open estimates, the highest option per job. Lost estimates are dismissed, or open over 90 days.
See jobs and estimates opens the full page, with a period picker, Filters for your offices and Export CSV. It adds Jobs OnePath booked, a By source table and Open estimates on OnePath jobs. Click a customer's name to open their job.
OnePath was there
OnePath was there yesterday (or last week) counts what OnePath followed and answered for the whole account: website visits followed, how many opened the scheduler or chat, conversations answered by the way they came in, the median time to the first reply, and what came in after your office closed. Visits need OnePath's script on your website, and the last figure needs your Business Hours.
See all sources opens the Sources tab.
Jobs you didn't book
See why under Needs a look opens this page. So does See why on a campaign's page, narrowed to that campaign. It sits under the Overview and has no tab of its own.
→ app.onepath.ai/dashboard/unbooked_jobs
Three tiles lead it: You can fix in settings, Job requests not booked and Price-list value (estimate). That value comes from your price list. It is not a quote.
Why they weren't booked groups the requests by Reason, Source or Office. Three reasons are yours to fix: Outside your service area, A service you don't offer and Your disqualification instructions. They stand open, each row with a Fix action such as Add ZIPs, Turn on or Edit instruction.
No Reason covers job requests from before 22 October 2026, when OnePath started recording why. Not booked, last 6 periods draws the trend, and Where maps the ZIP codes.
Pick a period or a Month above the tiles. Filters narrows by ad platform, source and office. Opening a row lists the job requests behind it, with names on purpose, so you can catch a wrong decline or call back.
Sources
The Sources tab is your funnel: how many conversations became job requests and then booked jobs, and who did the work.
→ app.onepath.ai/dashboard/sources
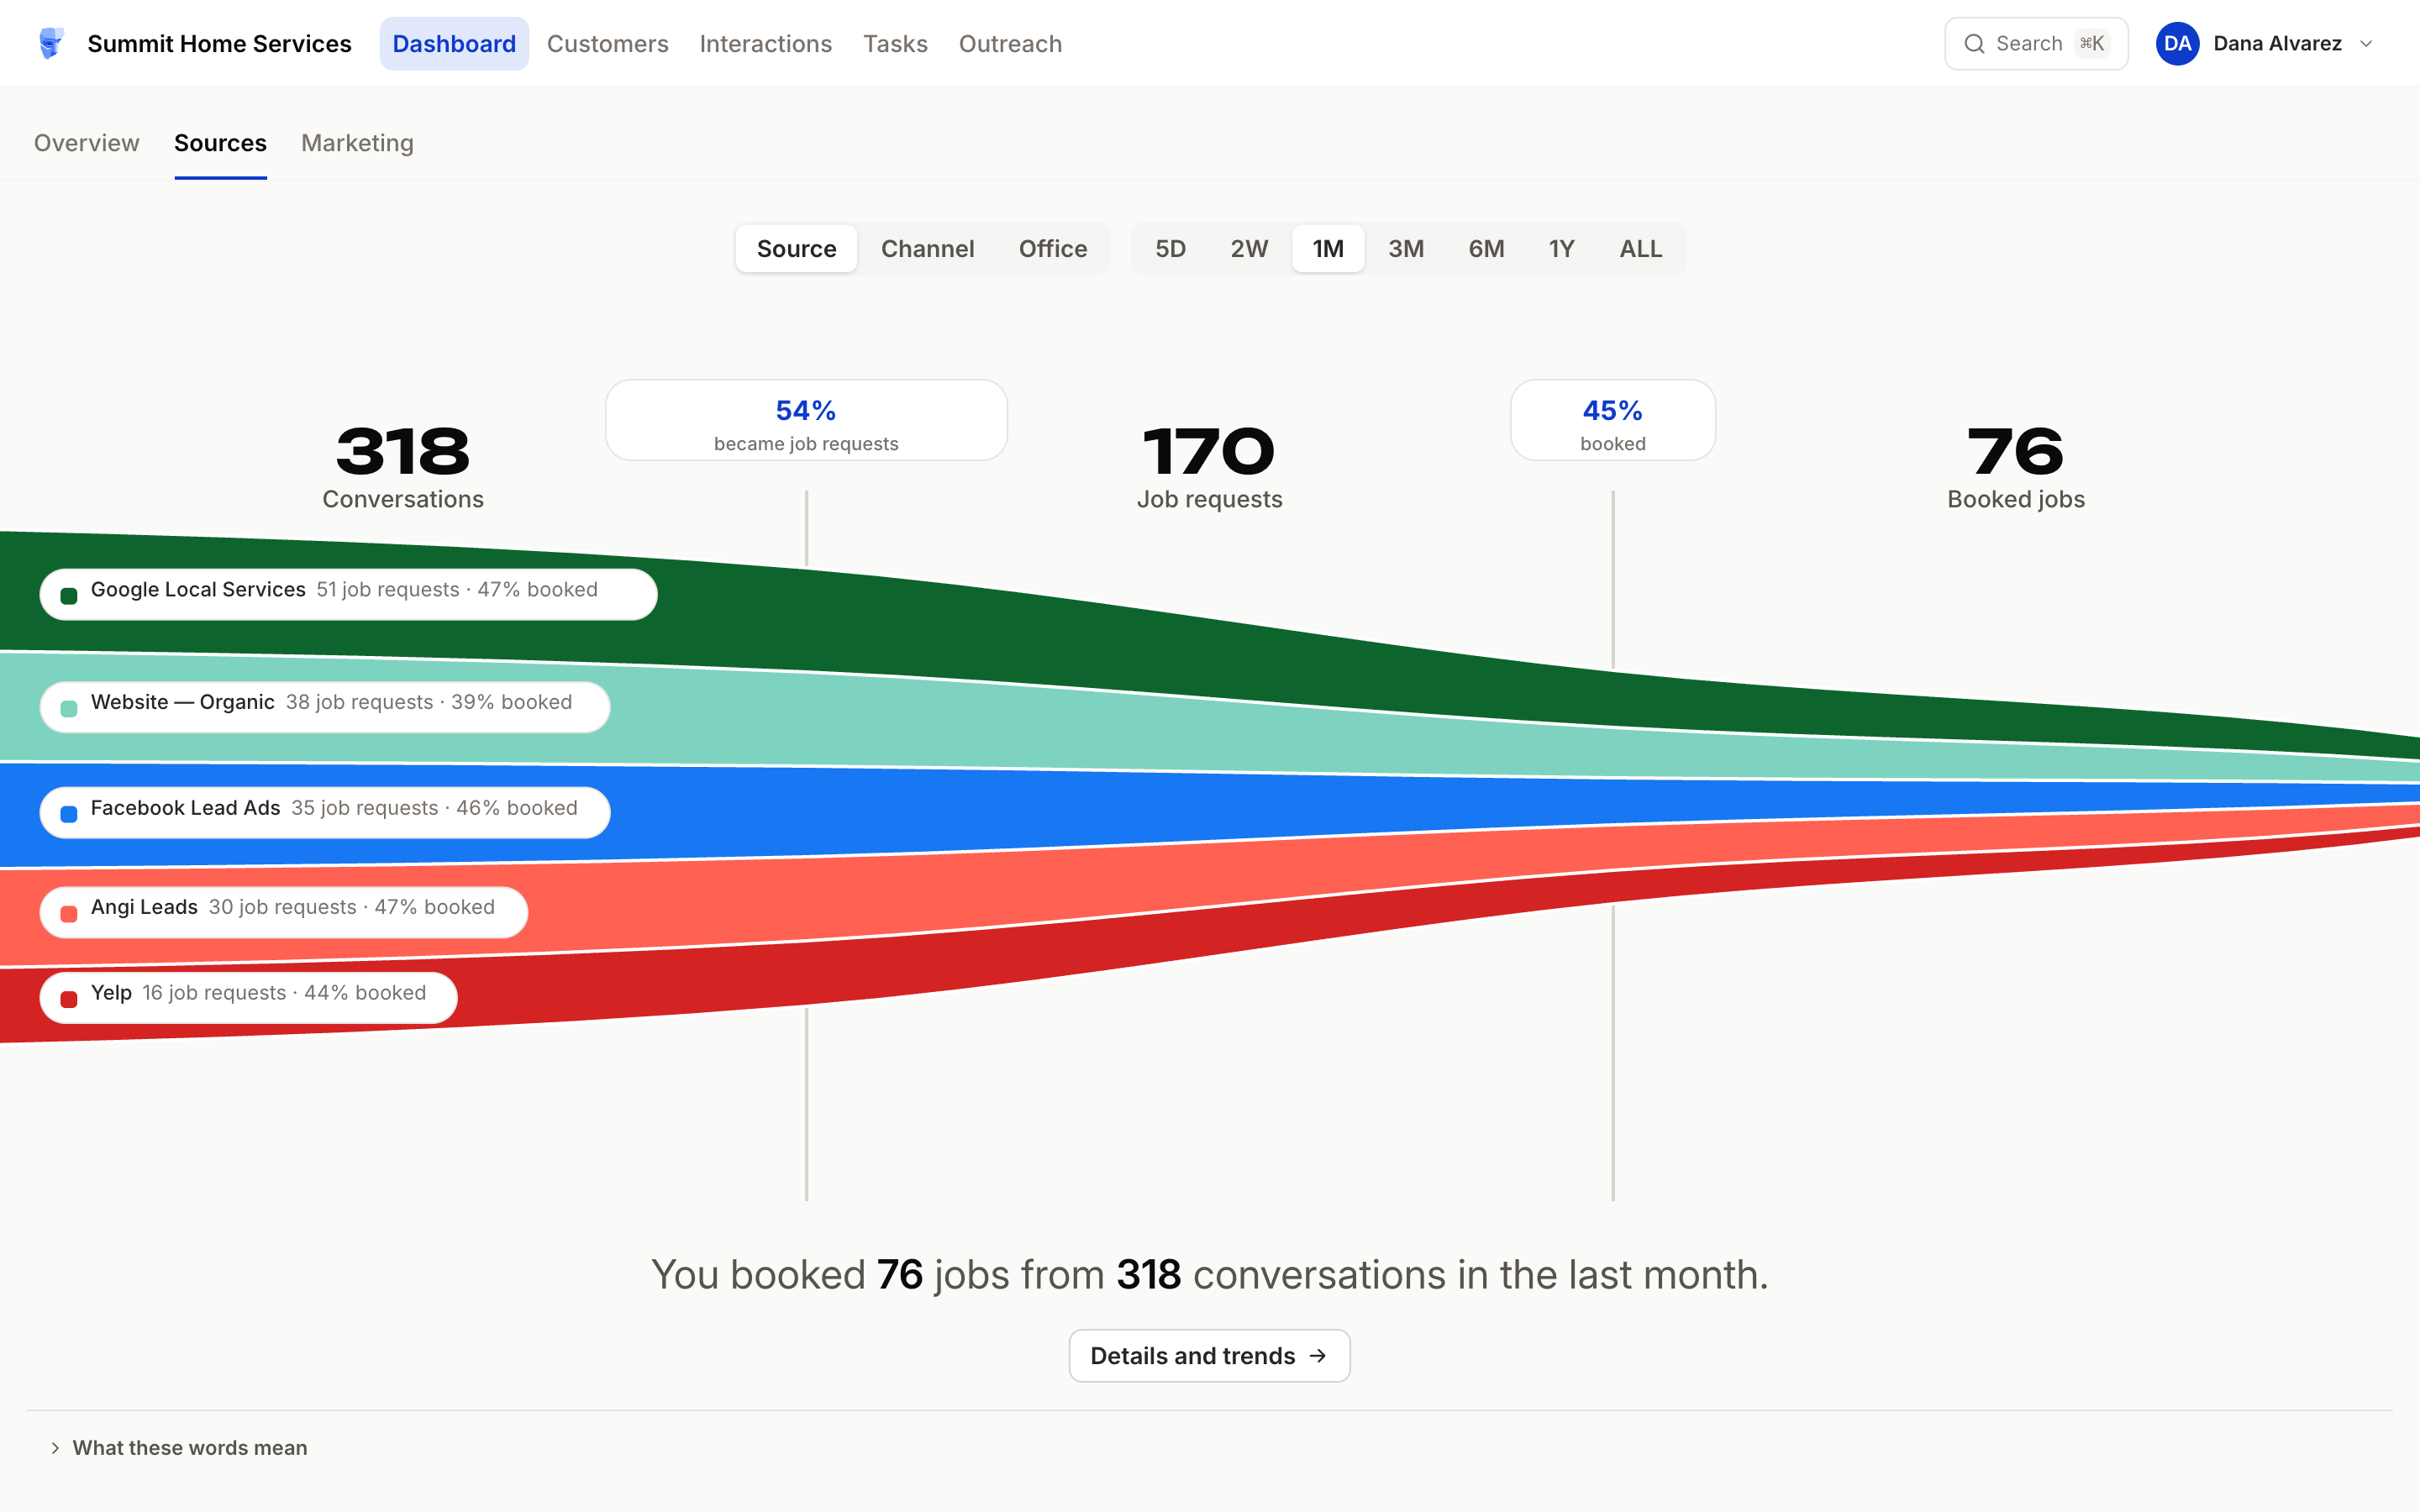
It opens by Source. Switch to Channel, or to Office with two or more offices. Pick a period from 5D to ALL, and the chart redraws with no reload. This tab has no Filters.
Between the three numbers, two pills show the share that moved on. Each band's label reads its job requests and the share that booked. The line under the chart sums up the period. With field service software connected, it adds what those jobs have made and what open estimates still hold.
- Click a number, a channel's or office's band, or the grey band of small sources → Details and trends, on the same period.
- Click a source's band → its own page.
Export CSV downloads This page's table or Every job request. With no conversations yet, the tab offers See sample data →, and Exit sample data takes you back.
Details and trends
Details and trends turns the funnel into a table, on the same period and grouping.
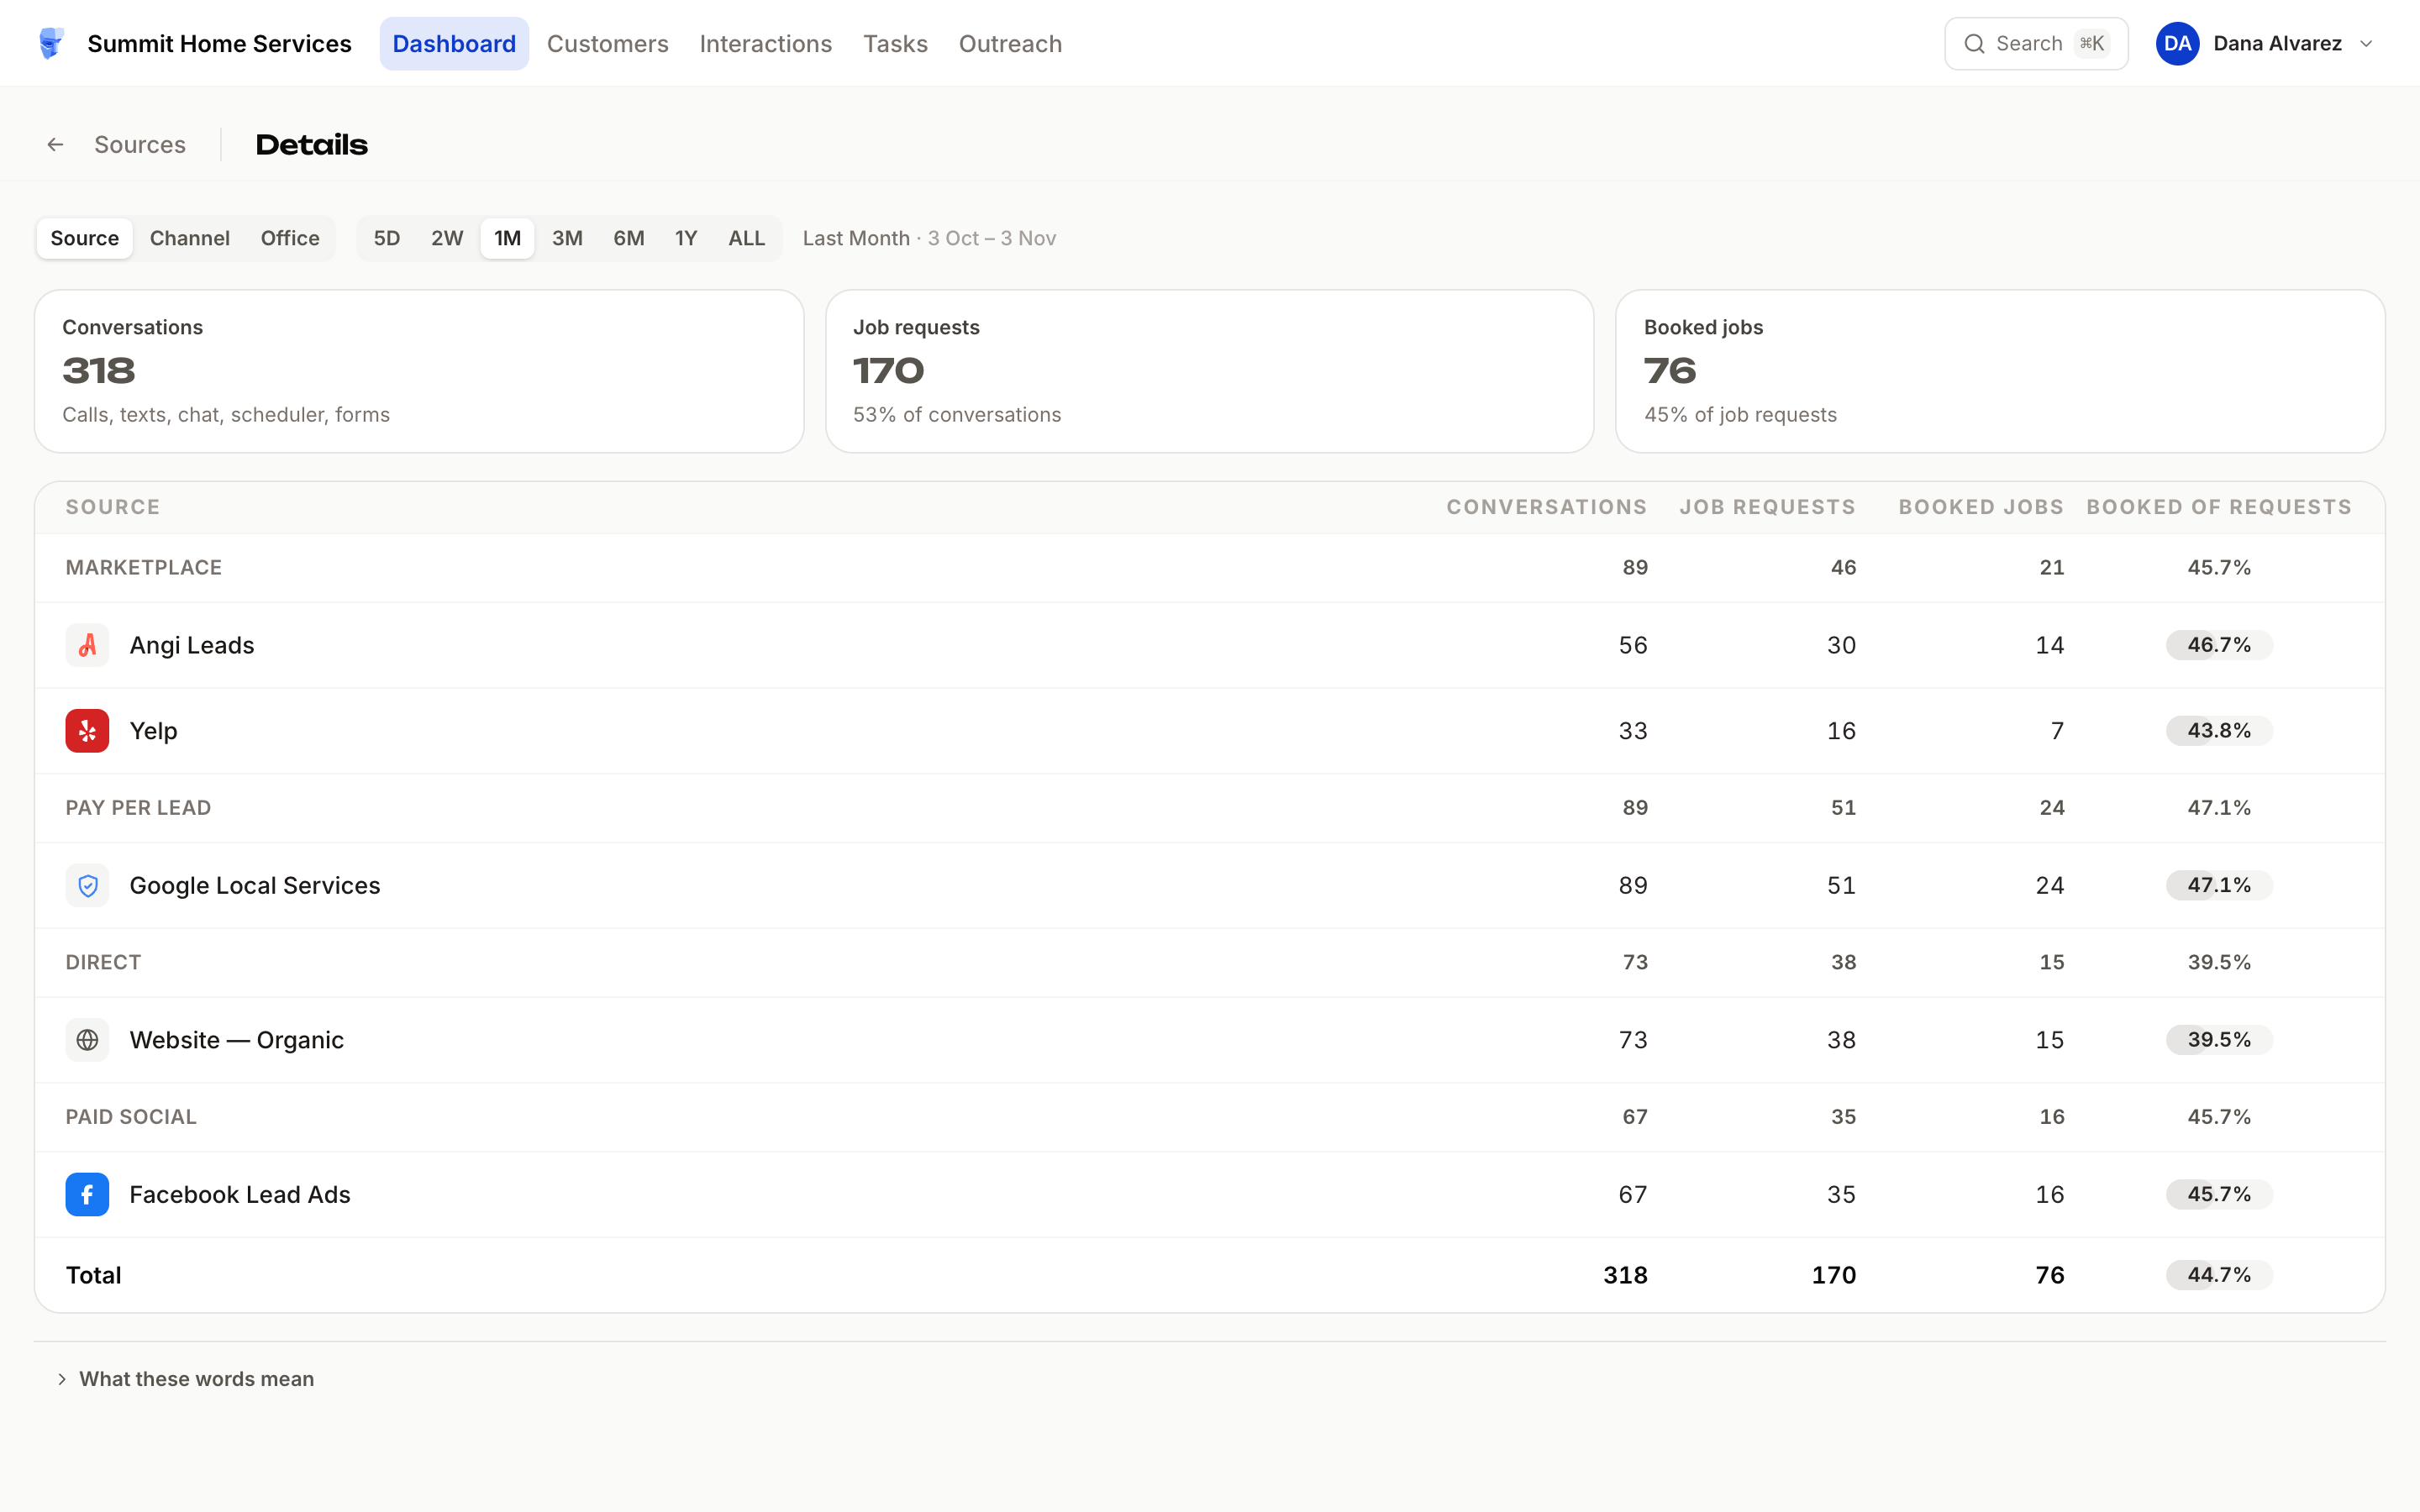
By source, rows stand under their category, such as Marketplace, Pay per lead, Paid search, Paid social, Organic search or Direct. Each row reads Conversations, Job requests, Booked jobs and Booked of requests. With field service software connected, a Realized Revenue column closes it, with what is still open underneath. By source, last 6 periods draws a line for each of the five that booked the most.
A source's own page
Click a source's name to open its page. It compares the source with your average, then adds Job requests and booked jobs, How they reached you, What they asked for and Why the rest didn't book. Under What they asked for, green beats this source's booking rate and red falls short of it.
Marketing
The Marketing tab shows what your ads cost and what they brought. You'll find it under the top bar, beside Overview and Sources.
→ app.onepath.ai/dashboard/marketing
Spend comes from your connected Google, Meta and Microsoft ad accounts. Google Local Services counts as Google. Connect them under Lead platforms. Campaigns come from tracking parameters on your links; see Campaign attribution.
With no ad spend in the period, the tab says No ad spend in this period and can offer Connect an ad account. Nothing is wrong: try a longer period, or connect an account.
Above the figures you pick the period. On this tab, Filters narrows by office only. If your role allows it, Export CSV downloads This page's table or Every job request.
What your ads brought back
With field service software connected, the tab opens on this card. Without it, nothing comes back to show, so the tab opens on the funnel and leaves out the money-back figures.
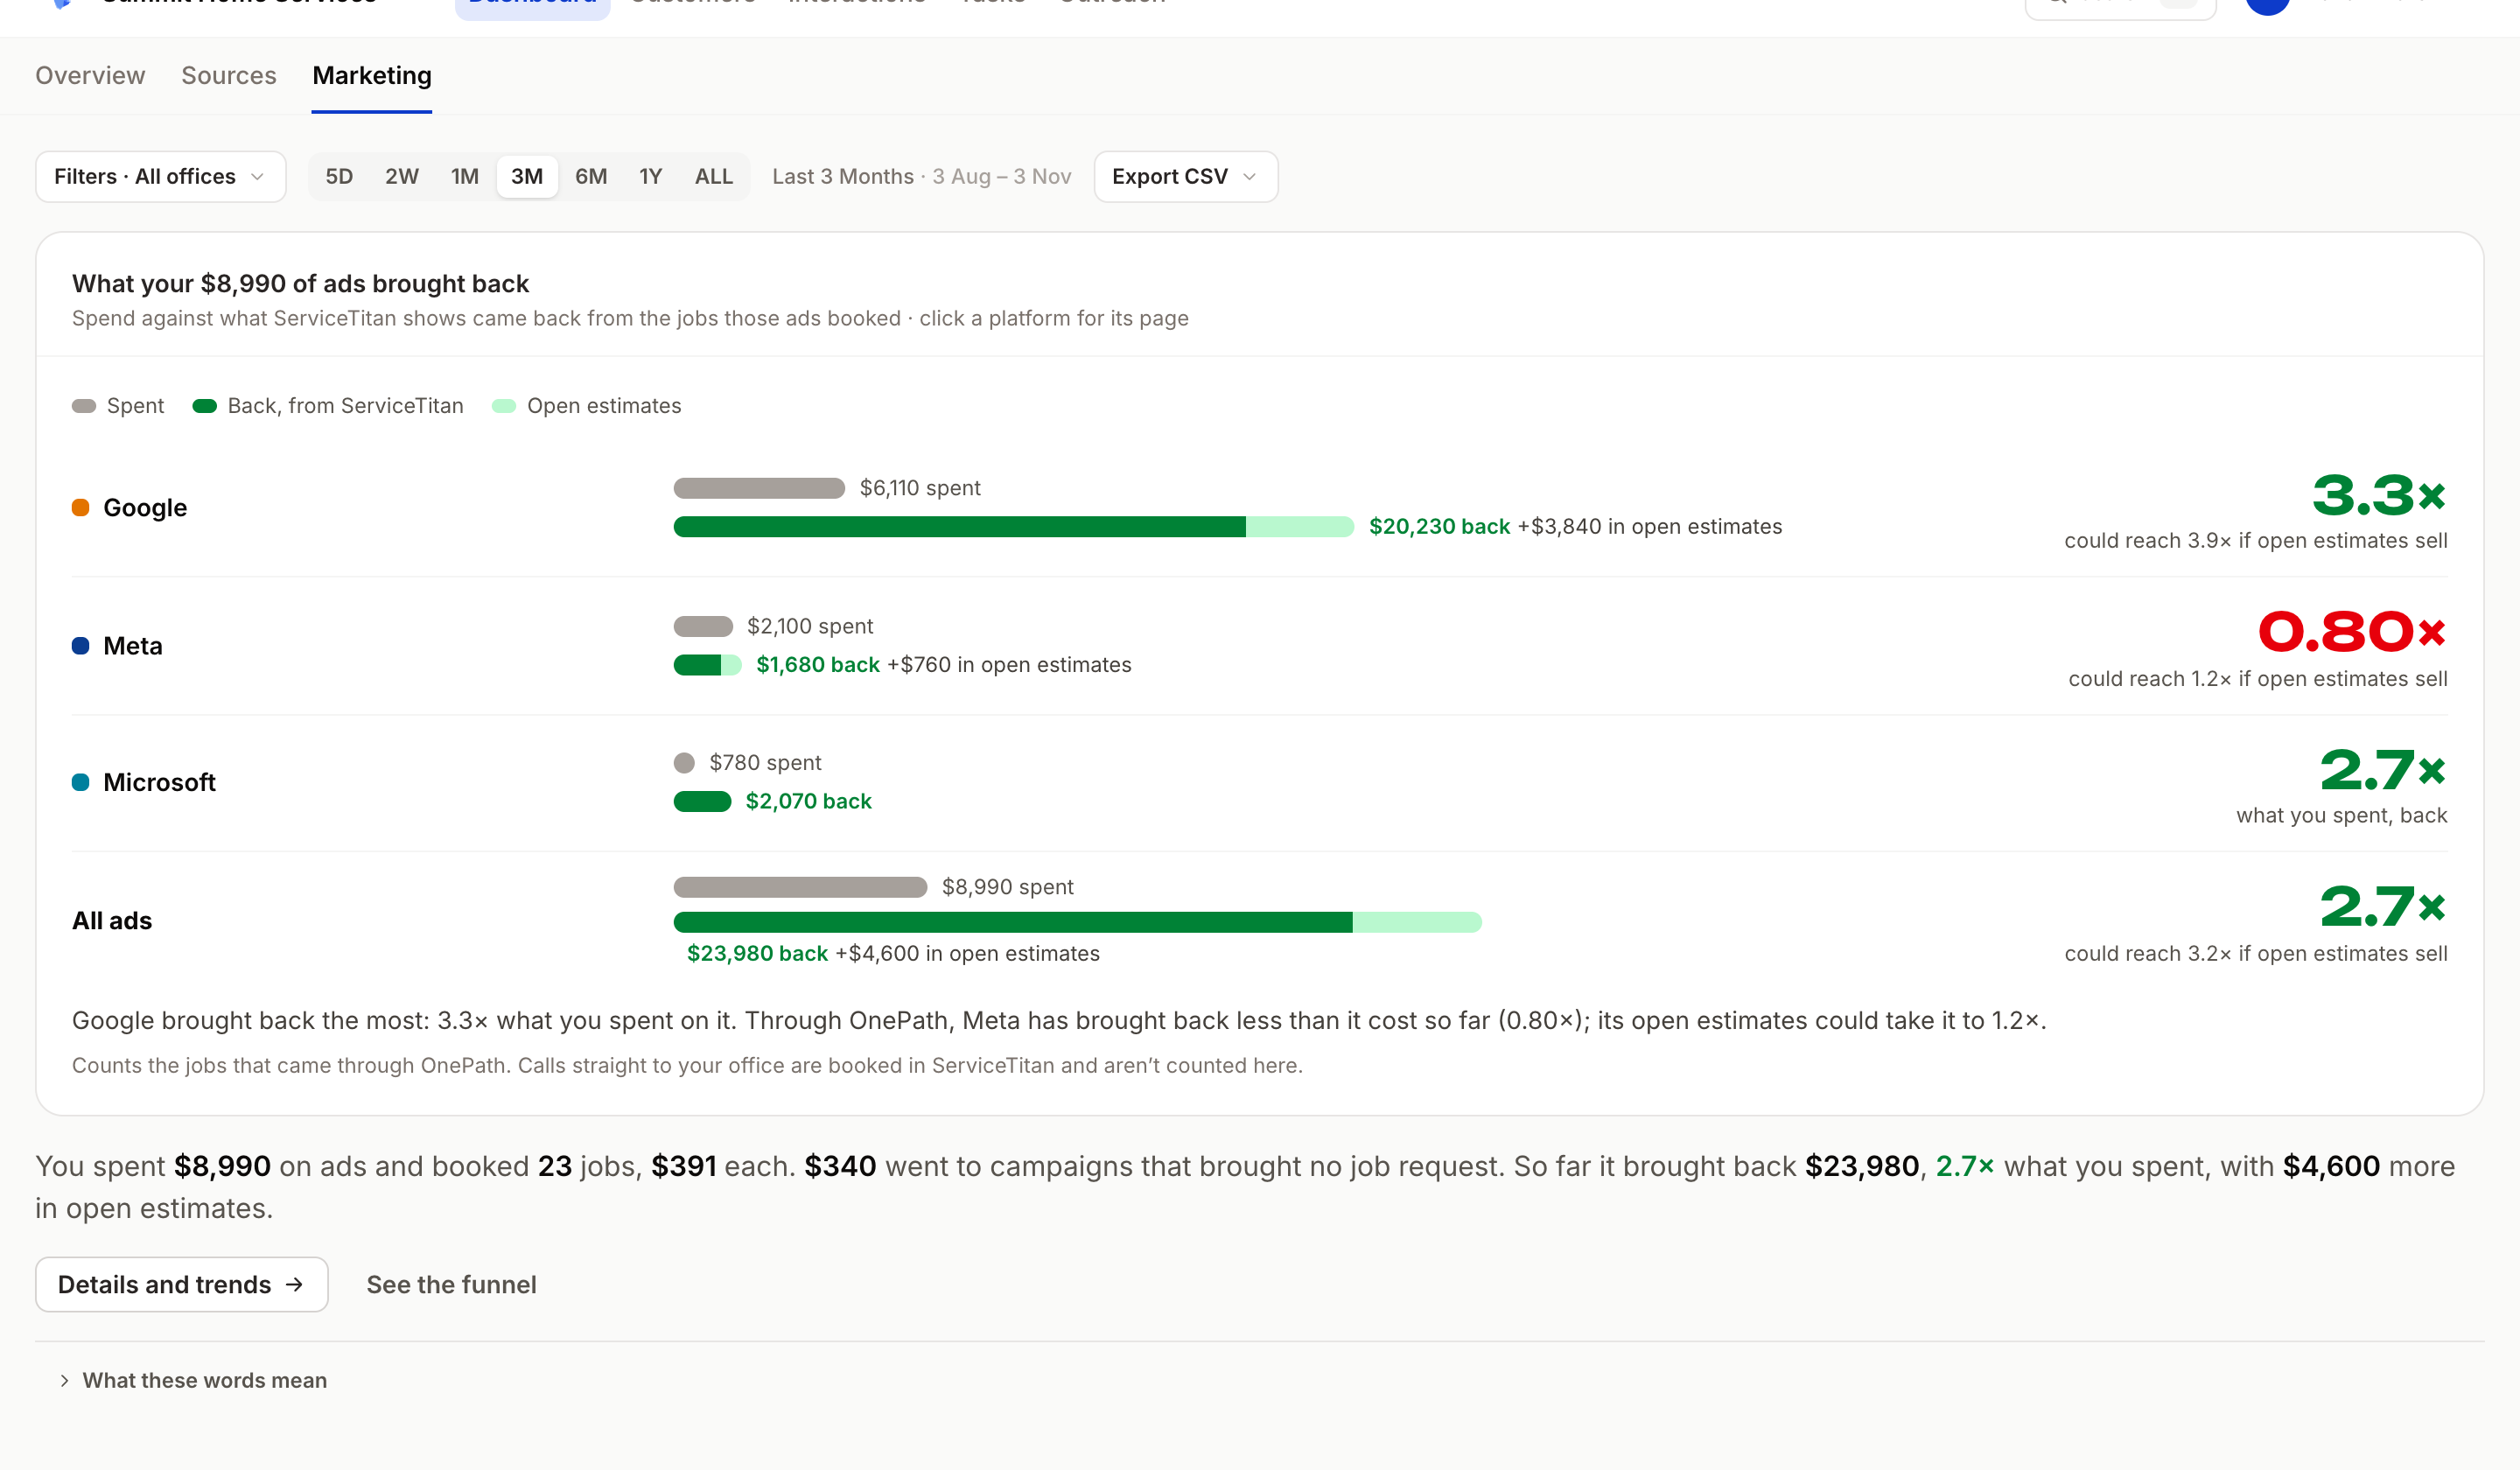
| On each row | Meaning |
|---|---|
| Spent | Ad spend in the period. |
| Back | Realized Revenue: invoices plus sold estimates on jobs OnePath booked, read from your field service software overnight. |
| Open estimates | Estimates on those jobs that aren't sold yet, the highest option per job. After 90 days they count as lost. |
| The multiple, such as 3.3× | Realized Revenue divided by ad spend. This is revenue back, not profit. |
The card counts only jobs that came through OnePath. Calls straight to your office are booked in your field service software and aren't counted. Click a platform to open its page.
The funnel
See the funnel opens it, and What your ads brought back returns to the card.
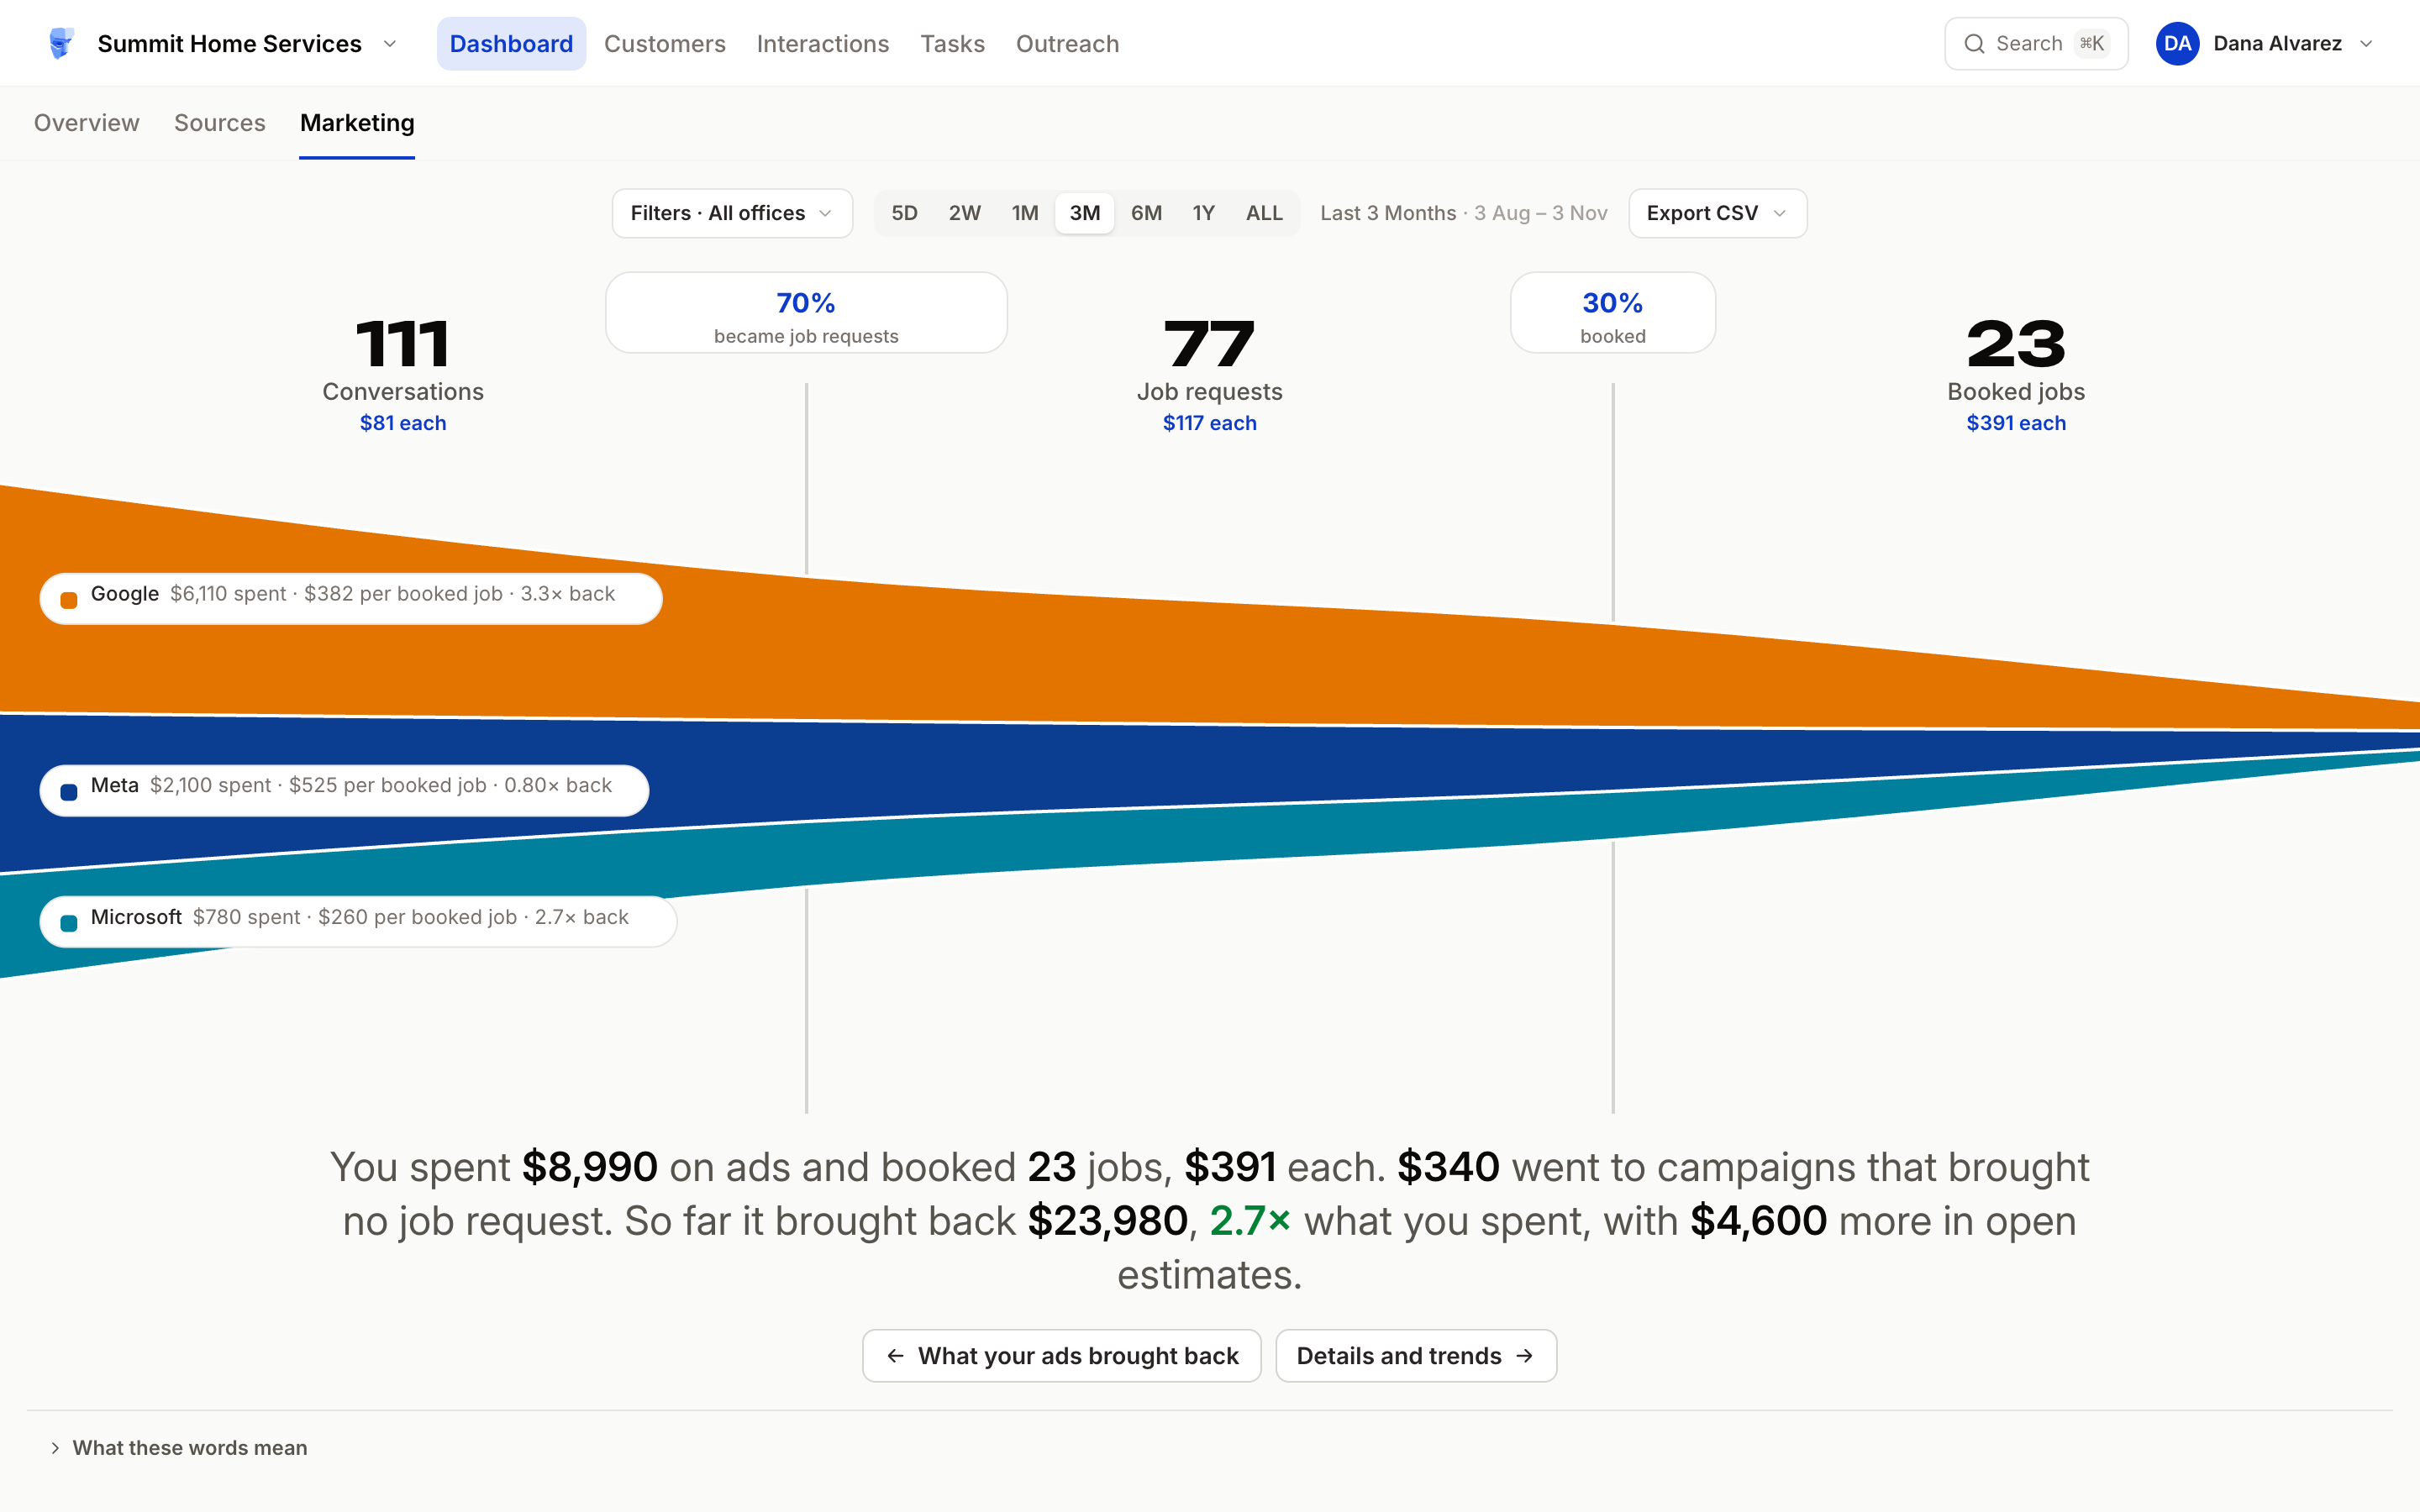
| Stage | Meaning |
|---|---|
| Conversations | Every call, text, chat, scheduler visit and form your ad campaigns brought. |
| Job requests | Each service a customer asked for, so a conversation asking for two services is two job requests. |
| Booked jobs | Job requests that arrived in the period and have an appointment booked so far. |
Under each stage, the "each" figure is your spend divided by that stage's count. Cost per job request is what you may know as CPL. The pills between stages show the share that moved on.
Each band is one ad platform, labelled with its spend and cost per booked job. With field service software connected, the label also shows its return. Click a band to open that platform's page, or a stage's count to open the details.
Details and trends
Details and trends keeps your period and adds these figures: Ad spend, Cost per job request, Cost per booked job, Booked jobs from ads and No-request spend. No-request spend is money on campaigns that brought no job request. With field service software connected, you also see Realized Revenue from ads.
Below them, By platform compares your platforms, and By office appears if you have offices to compare. Lead platforms lists Angi and Yelp, with no cost or return because no spend is read for them. More detail opens the last 6 periods and every step from ad to booked job. Here, Filters also narrows by ad platform.
A platform's page and a campaign's page
A platform's page has tabs for All platforms and each platform that spent. It shows that platform's Spend, Job requests, Booked jobs and Cost per booked job. Needs a look lists unbooked job requests, campaigns with no job request, and campaigns that haven't brought back what they cost.
The campaign table reads Spend, Impressions, Clicks, Job requests, Booked, Per request, Per job and Last 6 periods. With field service software connected, it also reads Realized Revenue. Use the Trend switch to draw Booked, Per job or Spend, and the Sort chip to reorder. A line under it counts job requests that came without an ad campaign, marked Unattributed.
Click a campaign's name to open its own page. It adds By ad group (By ad set on Meta), What they asked for and Why the rest didn't book. See why opens Jobs you didn't book for that campaign.
Not sure what a word means? What these words mean at the foot of each page opens the definitions.
How fresh are the numbers?
The Overview is read when you open it, and its brief is written each morning. The Sources tab's funnel and table are cached for up to six hours, and a source's own page for up to 30 minutes.
Ad spend is read from your ad platforms every four hours, and the campaign table shows when it last updated. Campaign figures are cached for up to 30 minutes. Realized Revenue updates overnight. If a lead landed a moment ago, give the Dashboard time to catch up.
Quick Tips
- ✅ Start with Needs a look - each line links straight to where you can act on it.
- ✅ Use a longer period on a young account - short periods produce jumpy booking rates.
- ✅ Compare Source and Channel on the Sources tab - Source tells you who sends people, Channel how they book.
- ❌ Don't read Realized Revenue as profit - it is revenue from jobs OnePath booked, and it counts nothing booked straight by your office without a OnePath conversation.